CUAFA 2024 Community Survey Summary
Introduction
In 2024, the Columbia University Asian Faculty Association surveyed its membership about work satisfaction, belonging, work–life balance, and well-being. A total of 105 faculty responded — 42 from CUIMC, 24 from Arts & Sciences, and 11 from SEAS, with the remainder spread across other schools. Respondents were 52.9% female and 47.1% male, and roughly 80% were U.S. citizens.
The survey was conducted under the leadership of then-CUAFA president Yiping Han, with contributions from Executive Committee members Qin Gao, Anette Wu, and Tian Zheng, along with their students.
Two findings sit at the center of the results. Since CUAFA’s inauguration in 2020, Asian faculty report a stronger sense of belonging — both within their own academic units and at the university level. AAPI faculty remain concerned about their underrepresentation in leadership roles, and report that AAPI concerns receive limited attention, with few dedicated institutional responses to anti-Asian hate.
Figure 1 — Who responded
Age distribution of the 105 respondents. The sample spans six decades of academic career stage, from early-career faculty to emeritus colleagues.
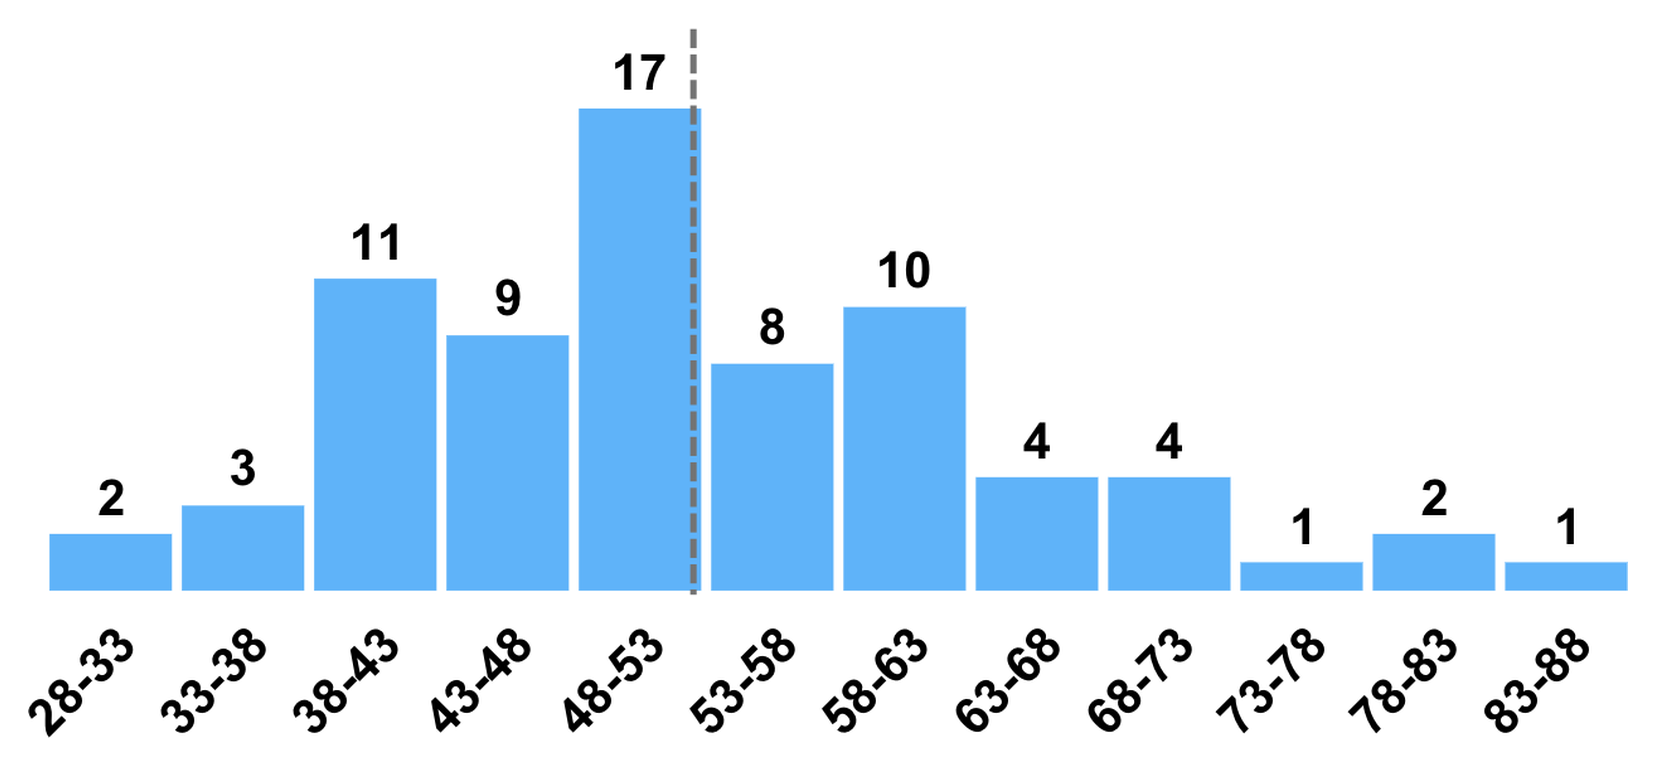
Figure 2 — Belonging has improved since 2020
Agreement with statements about Asian faculty belonging and representation. Belonging has moved. Representation and visibility have not.
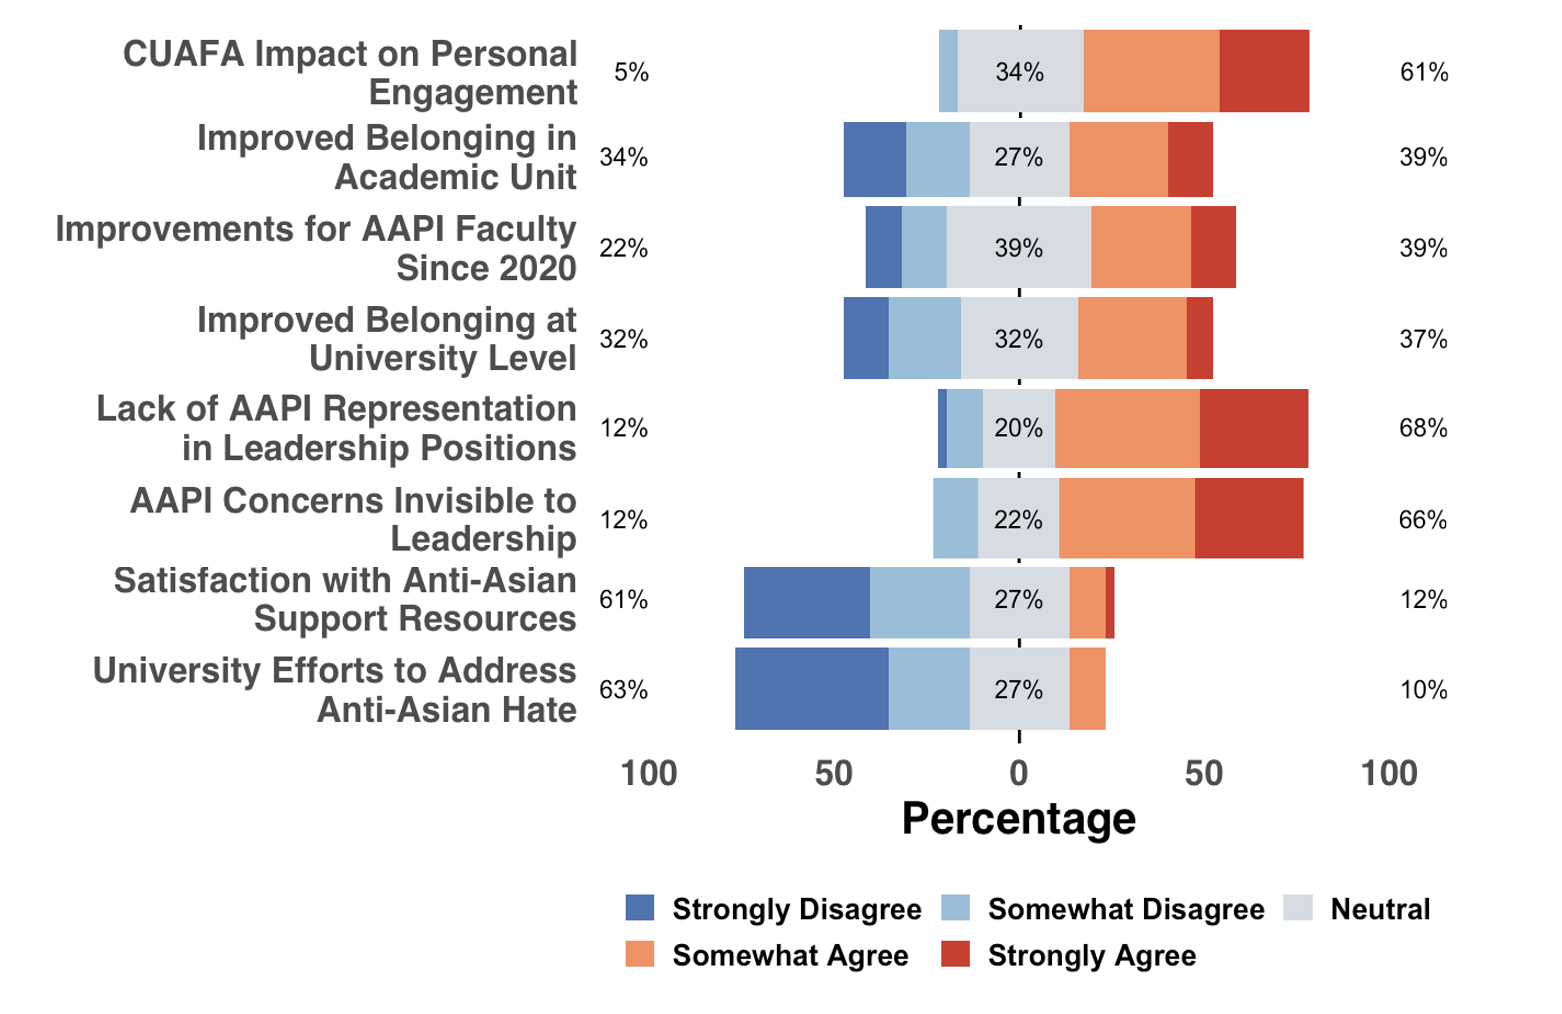
Figure 3 — Satisfaction, category by category
Satisfaction levels by category.
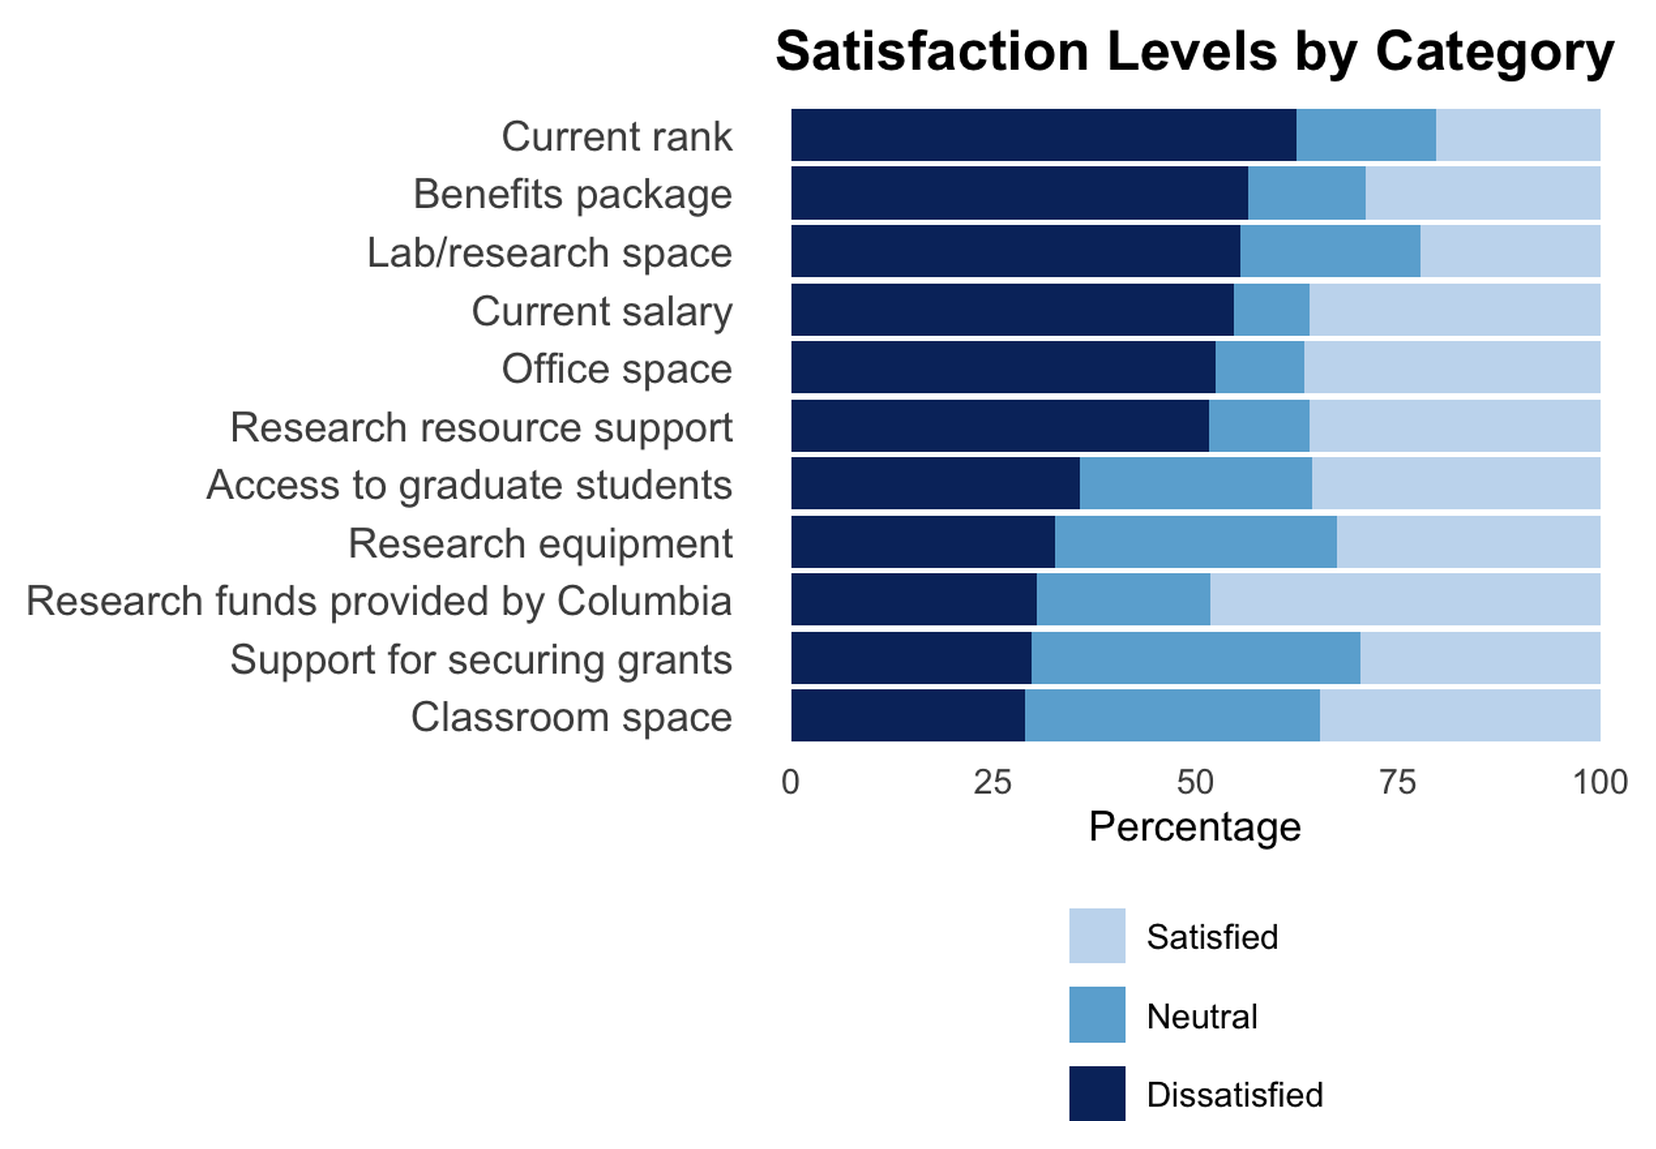
Figure 4 — What actually drives satisfaction
Salary, academic support, and benefits show the strongest positive impact on overall work satisfaction.
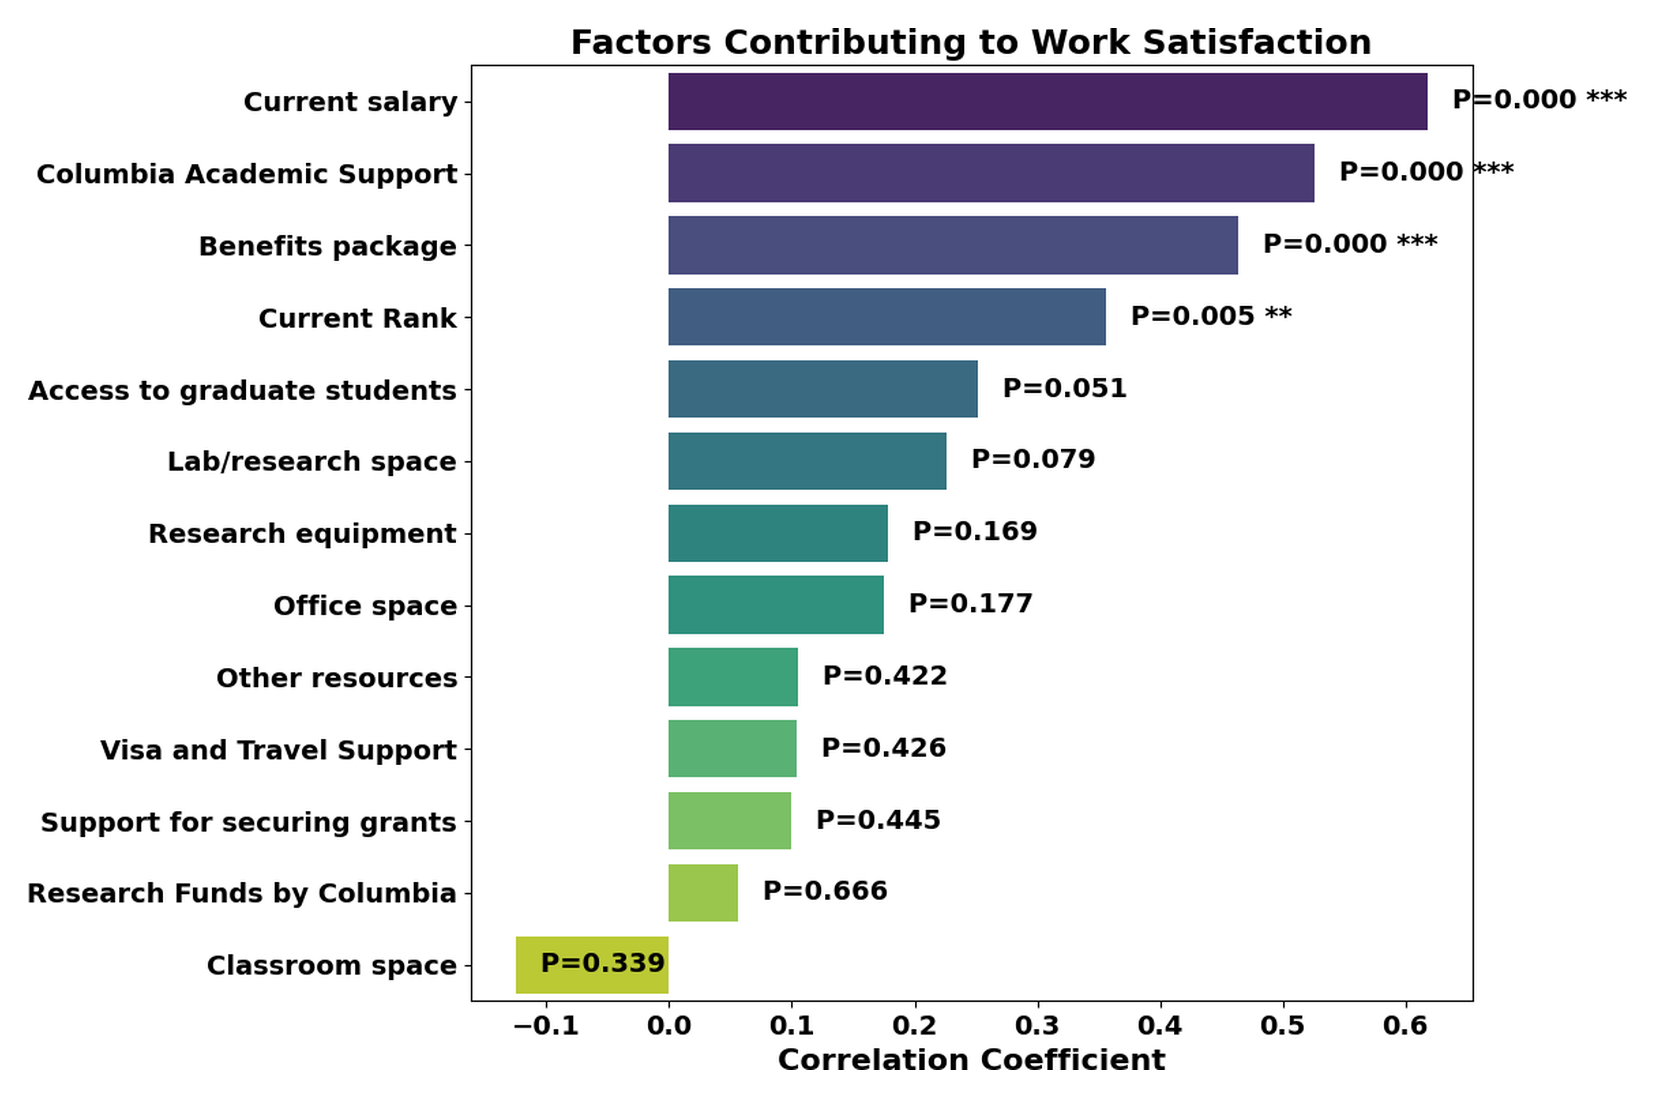
Figure 5 — Work–life balance
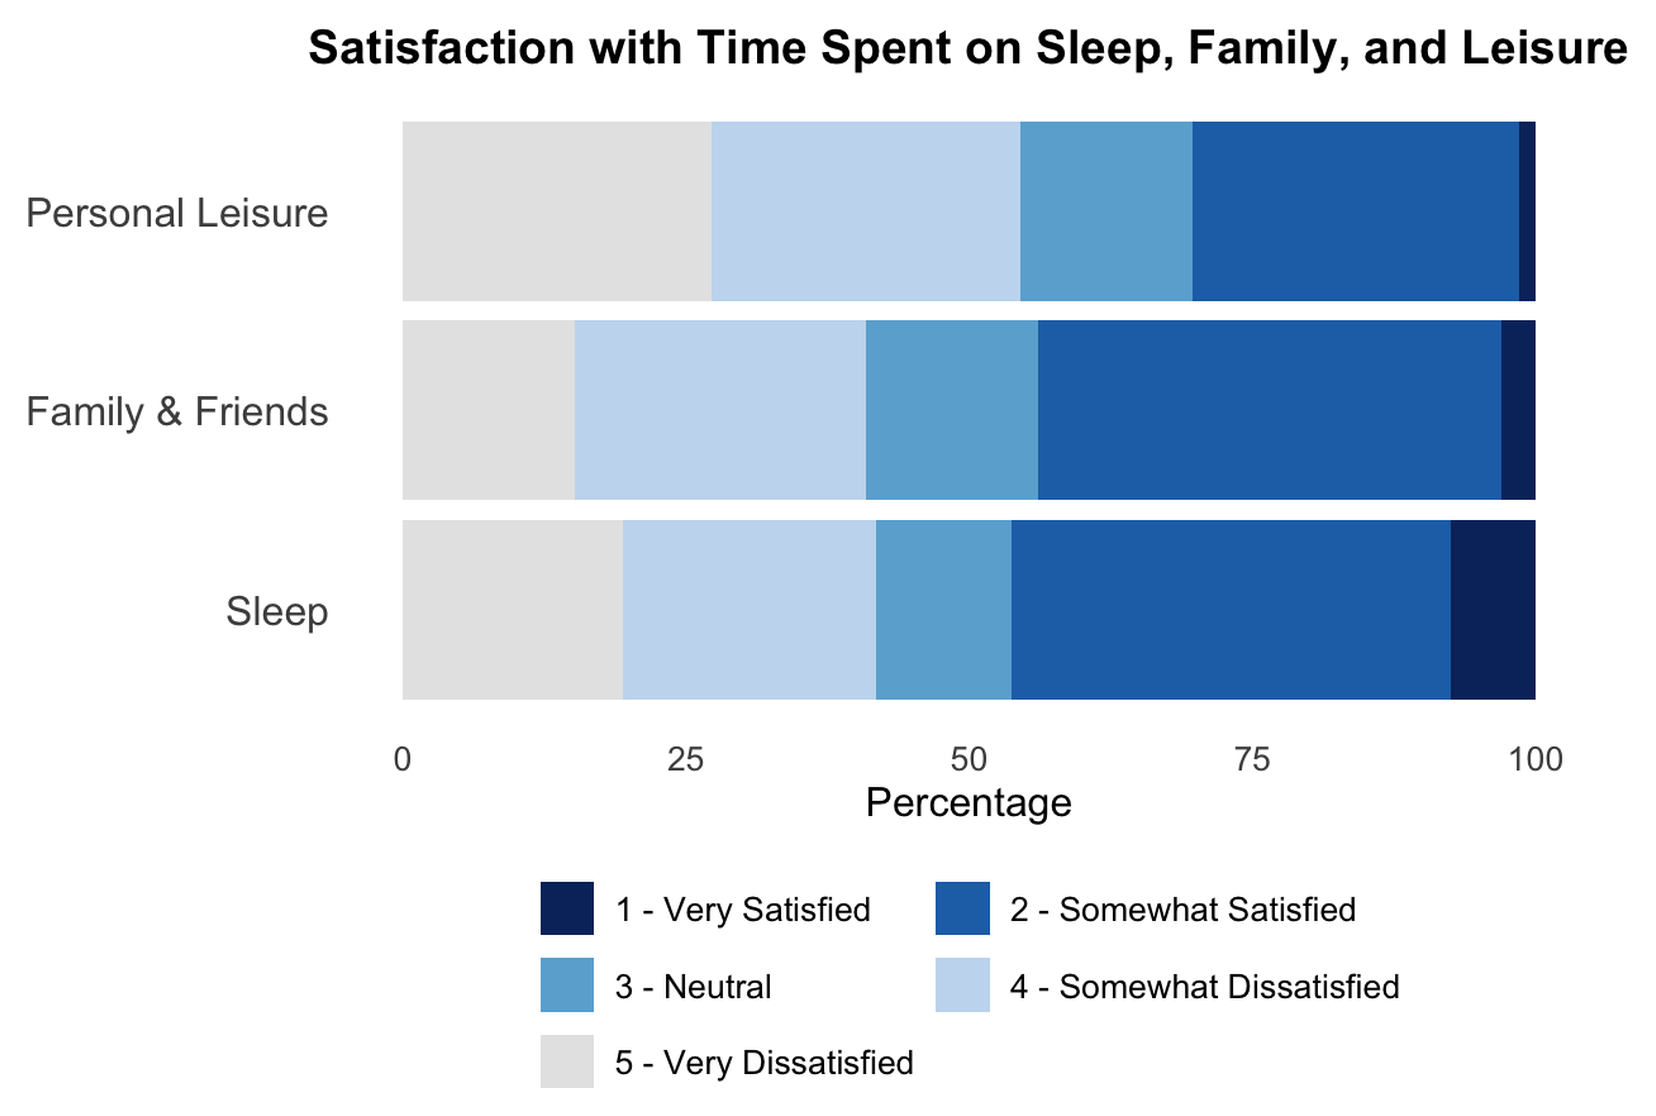
Figure 6 — Well-being and support
Caregiving and household responsibilities carried by respondents.
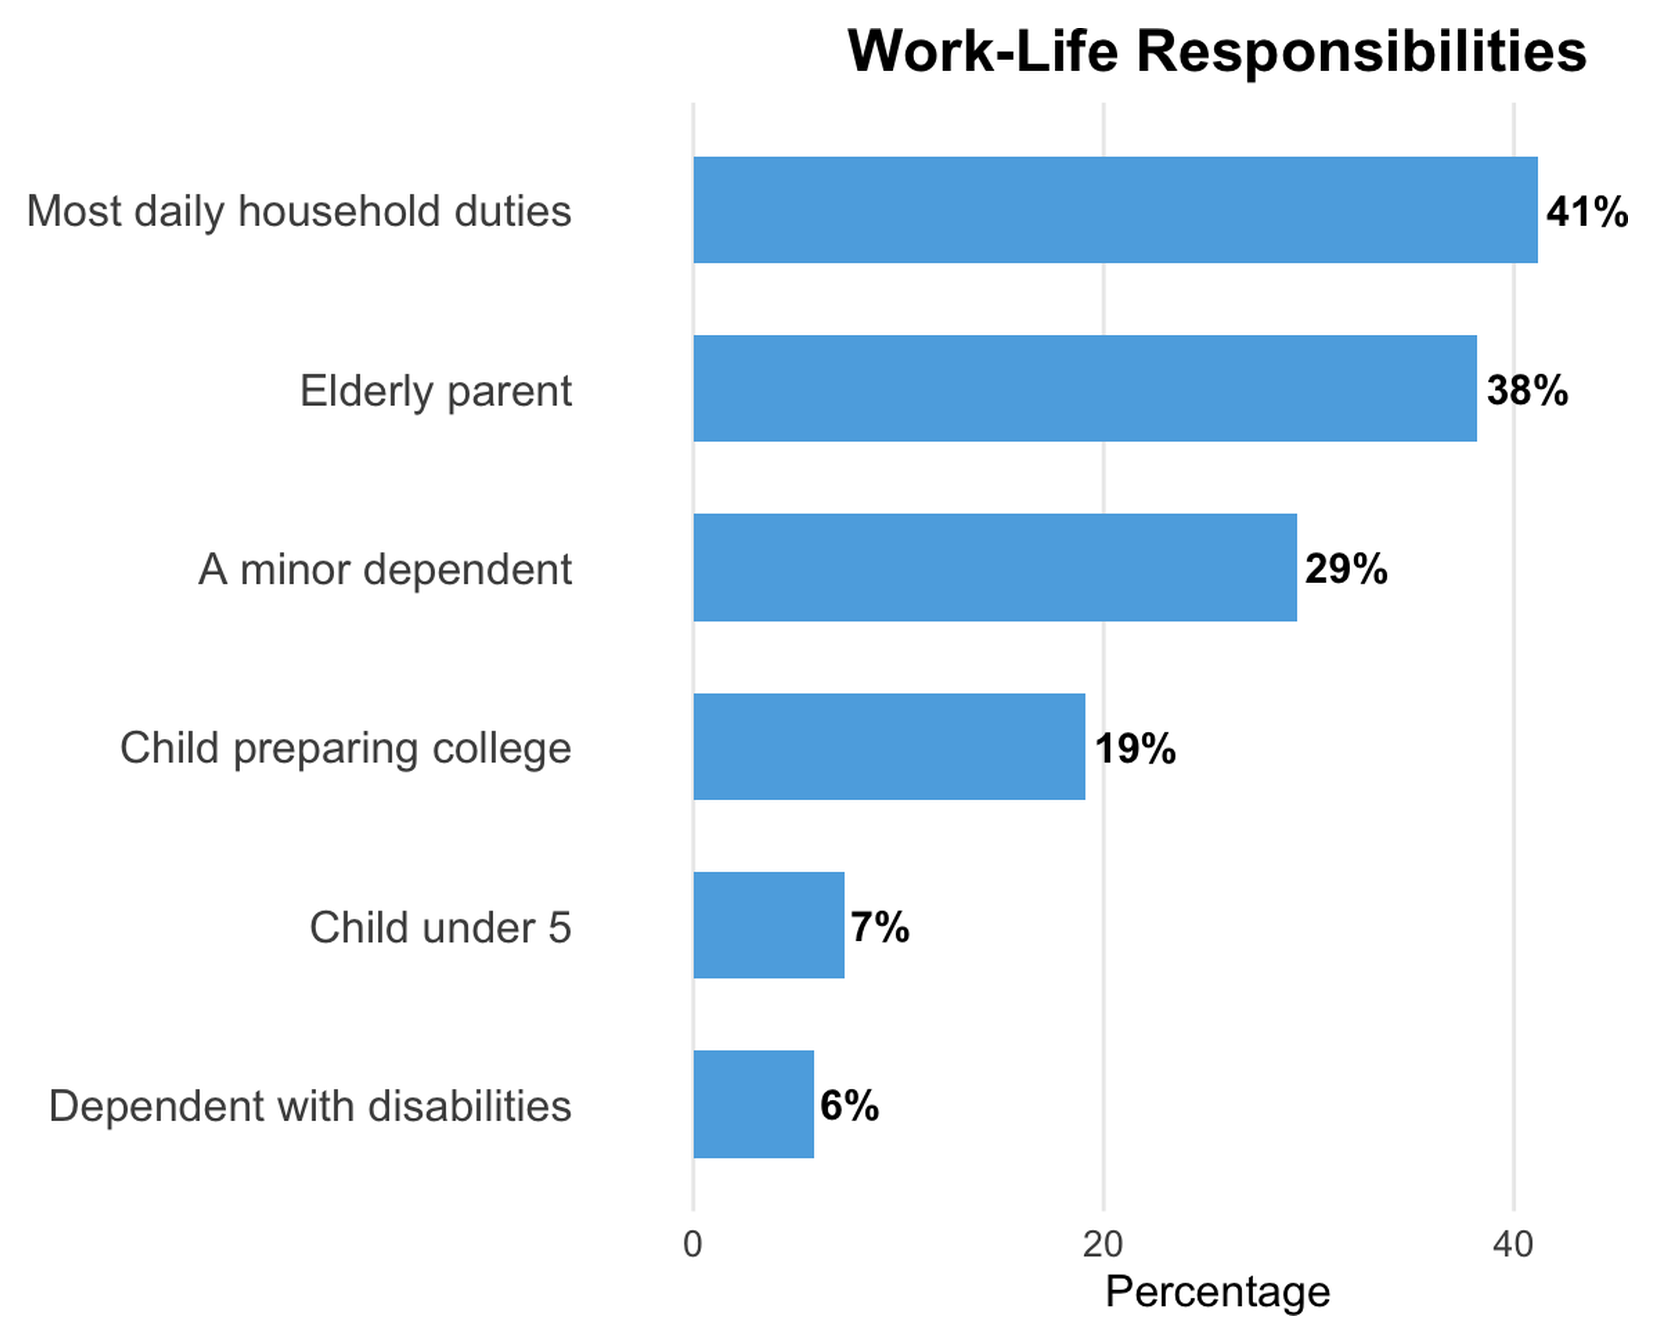
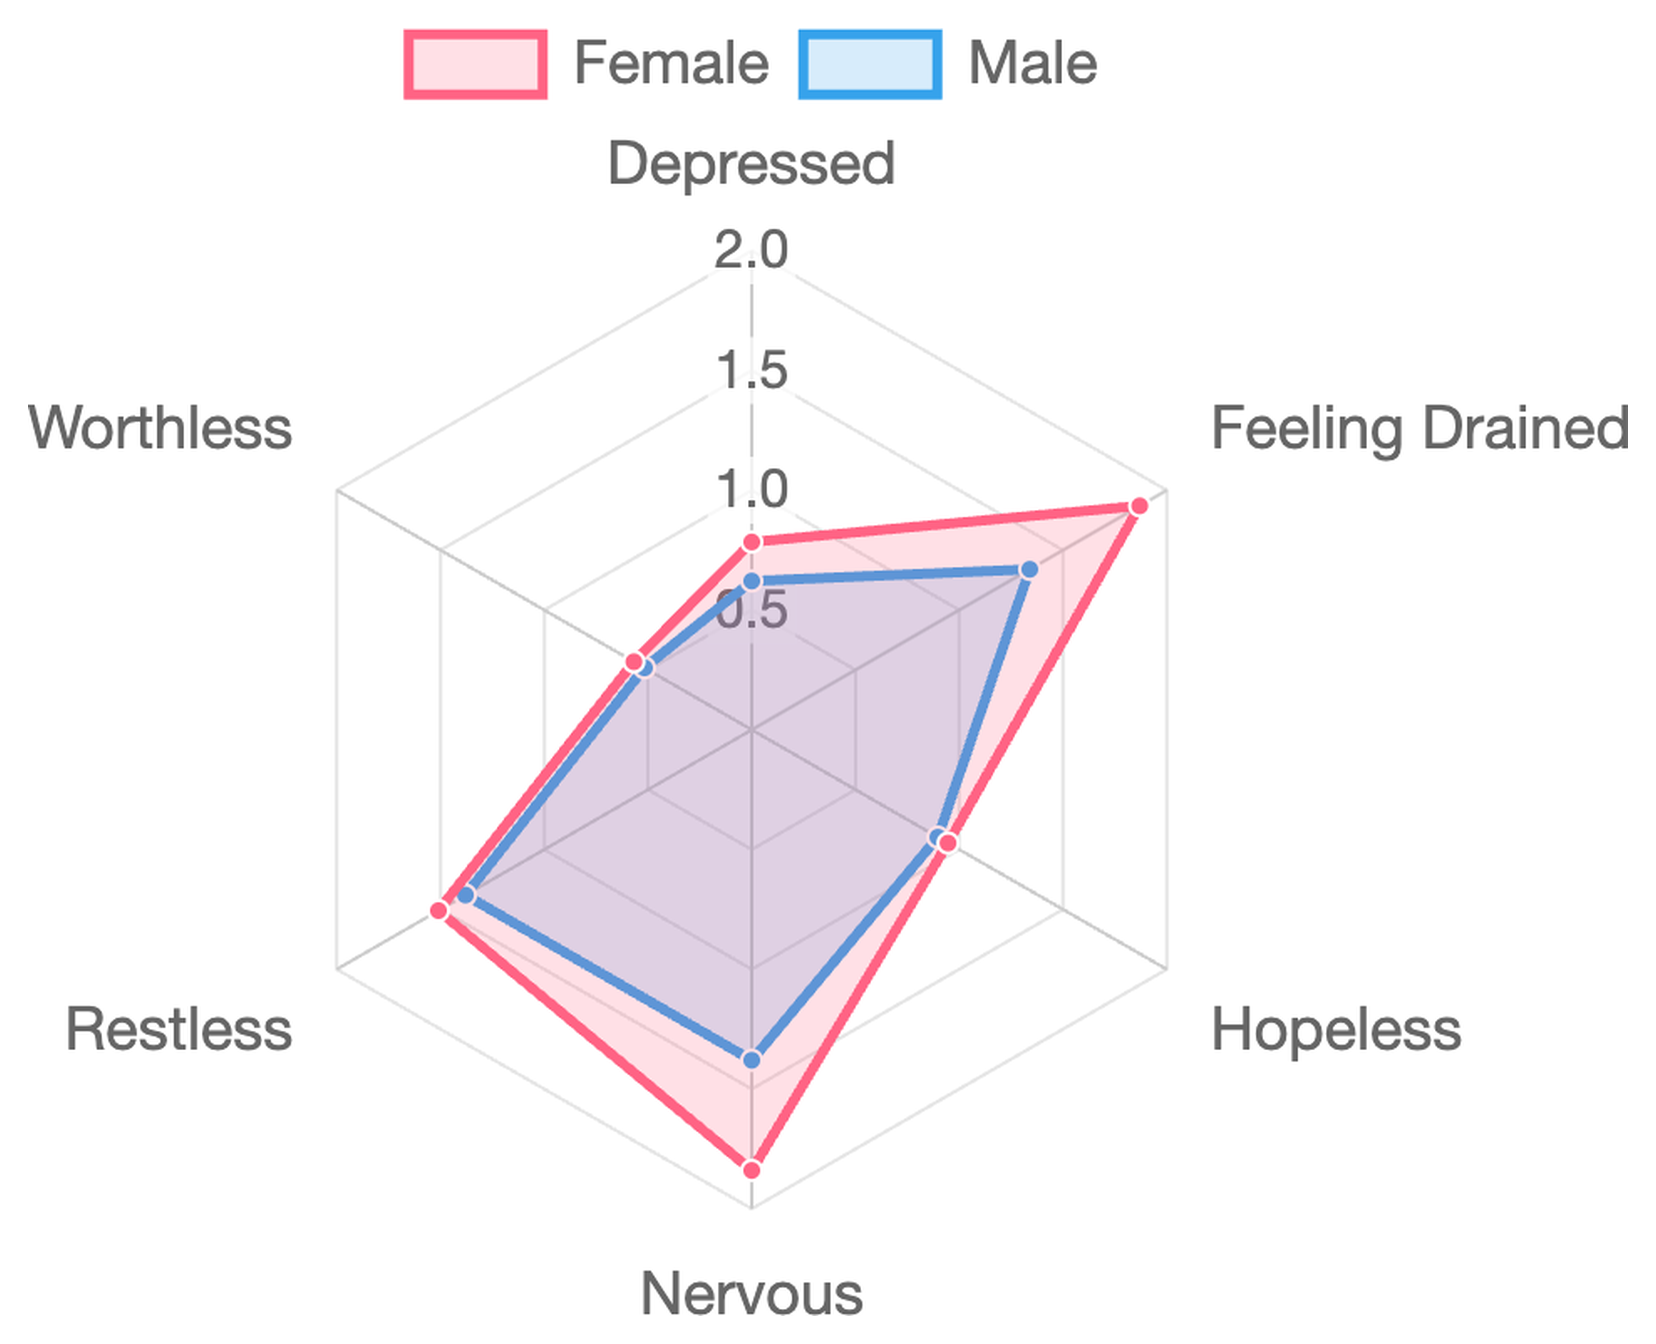
Figure 7 — Female faculty report more stress
Emotional stress by gender. Female faculty reported higher stress than their male counterparts across the measure.